For this it was an exe file,
Unintented Solve
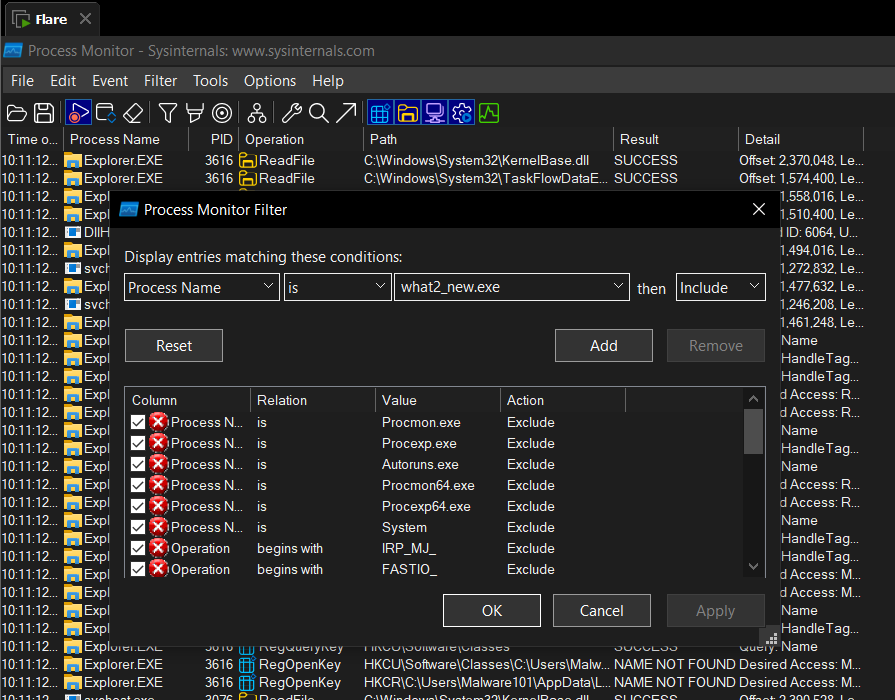
The easiest way to solve this was through checking the processes created by the file on procmon. Process Monitor(procmon) is an advanced monitoring tool for Windows that shows real-time file system, Registry and process/thread activity. You can get procmon here
In procmon set filter:
When we run the file, we should see some activity on procmon:
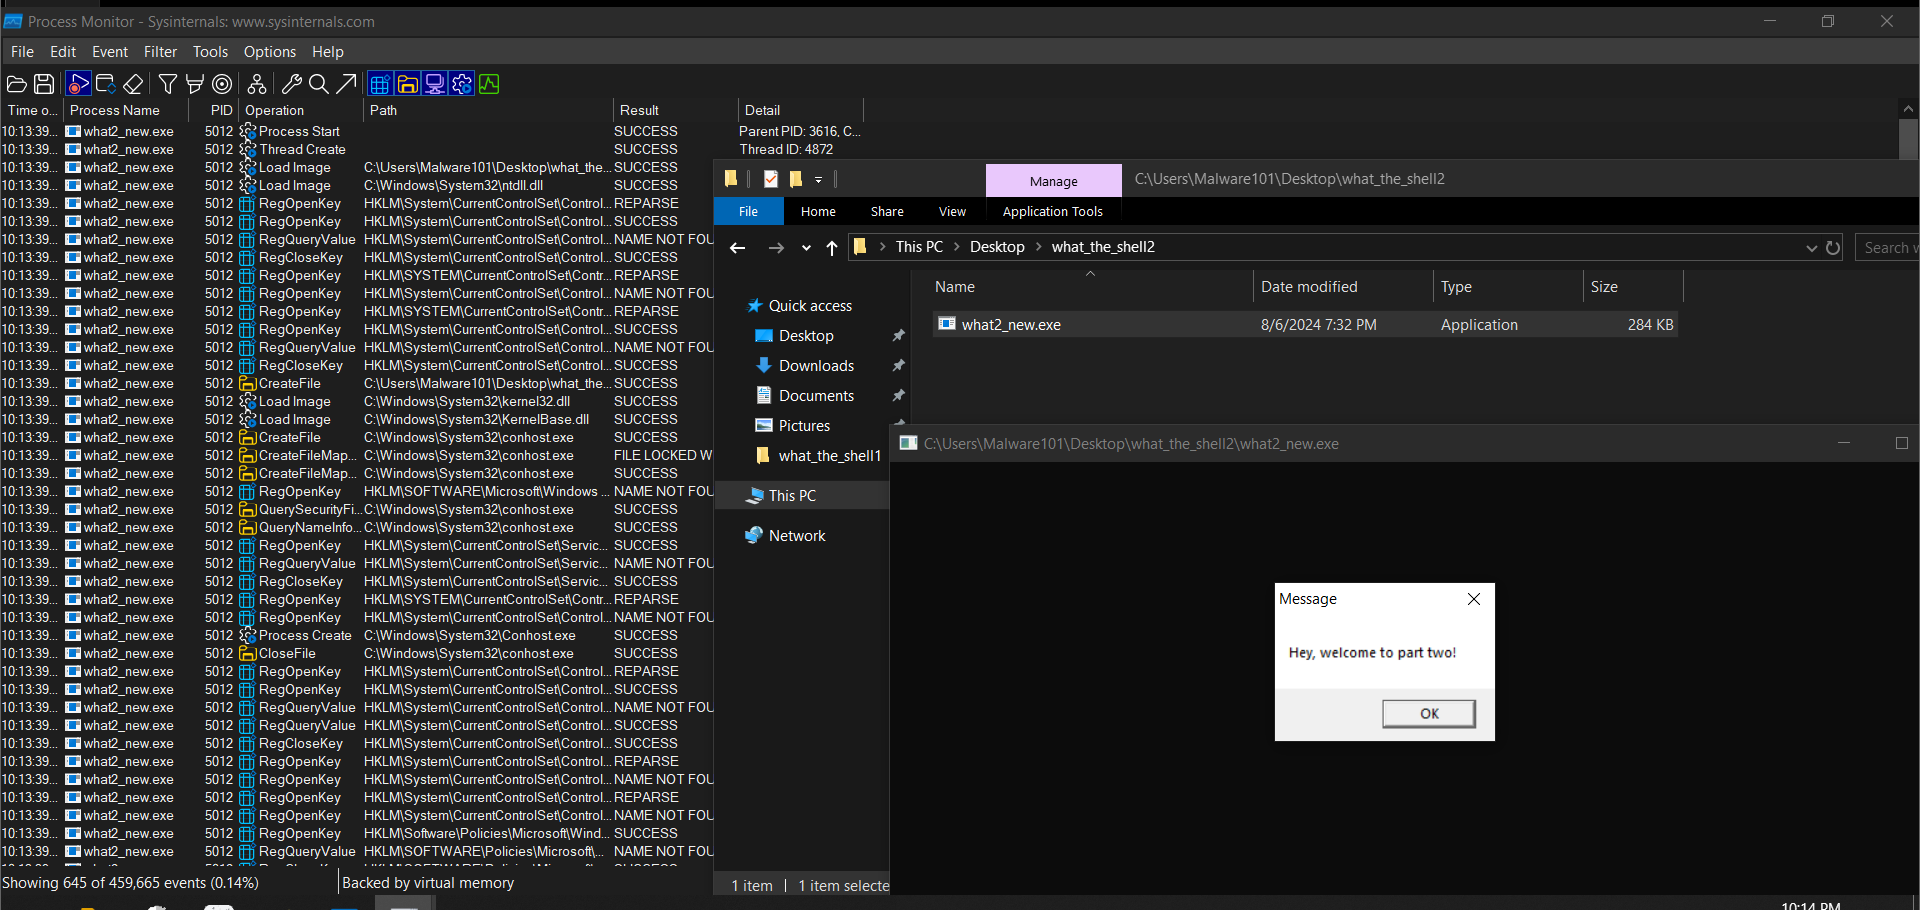
We can see it opens a message box saying “Hey, welcome to part two”, also in procmon we see activity, going to process tree in procmon:
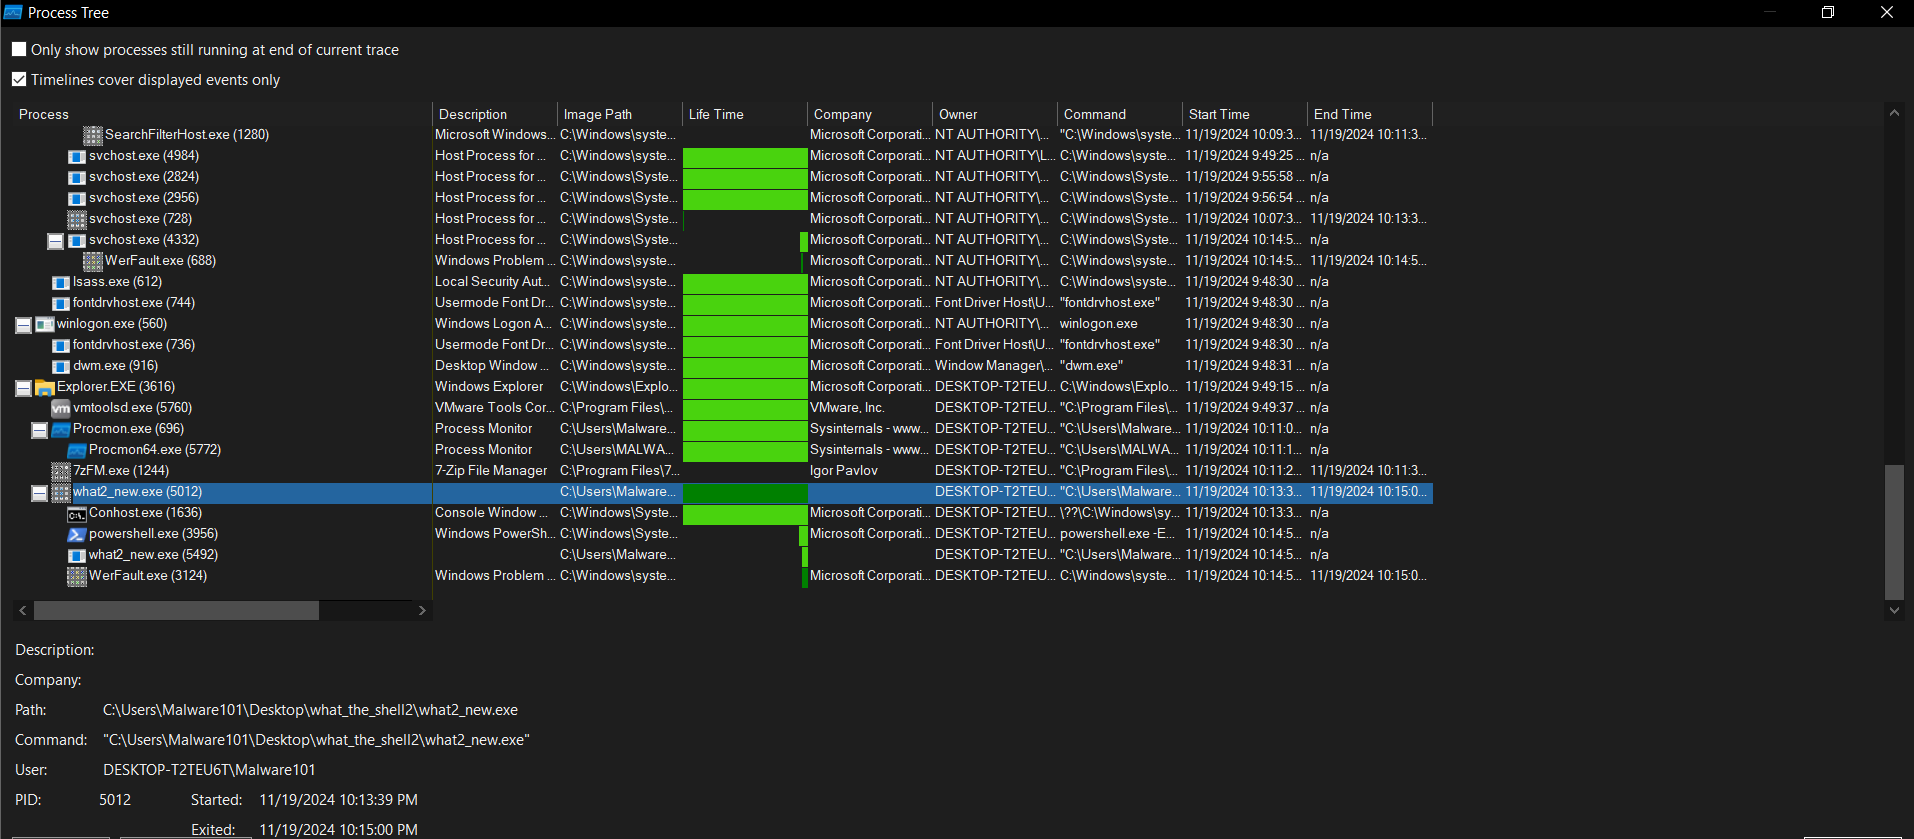
We see the exe file has 2 sub-processes with the most interesting being powershell child process, in this process:
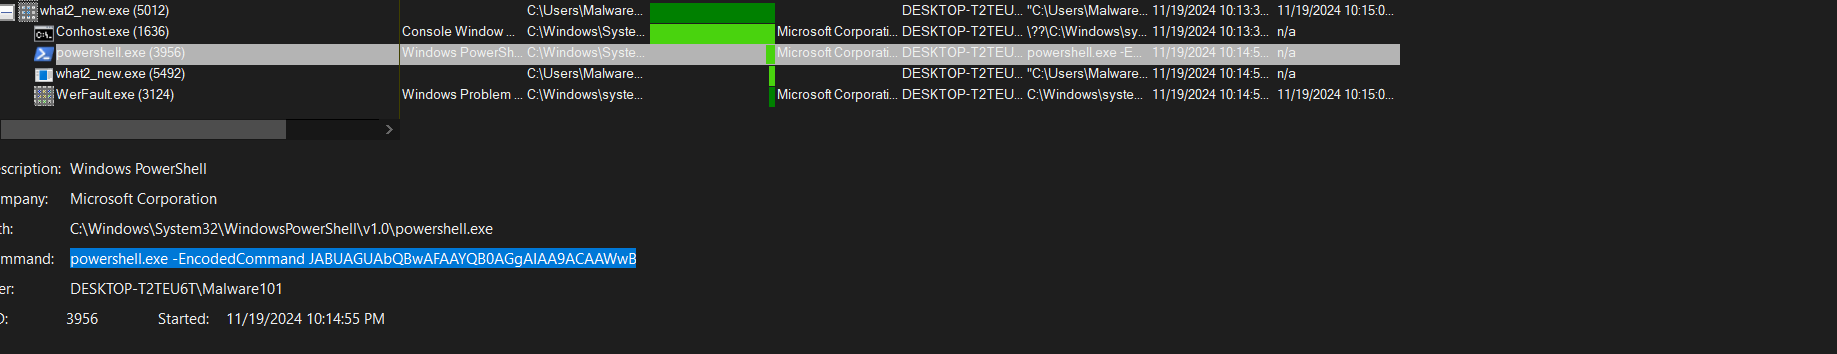
The following command is being ran on the background:
| |
Decoded the base64 code in cyberchef and remove null bytes:
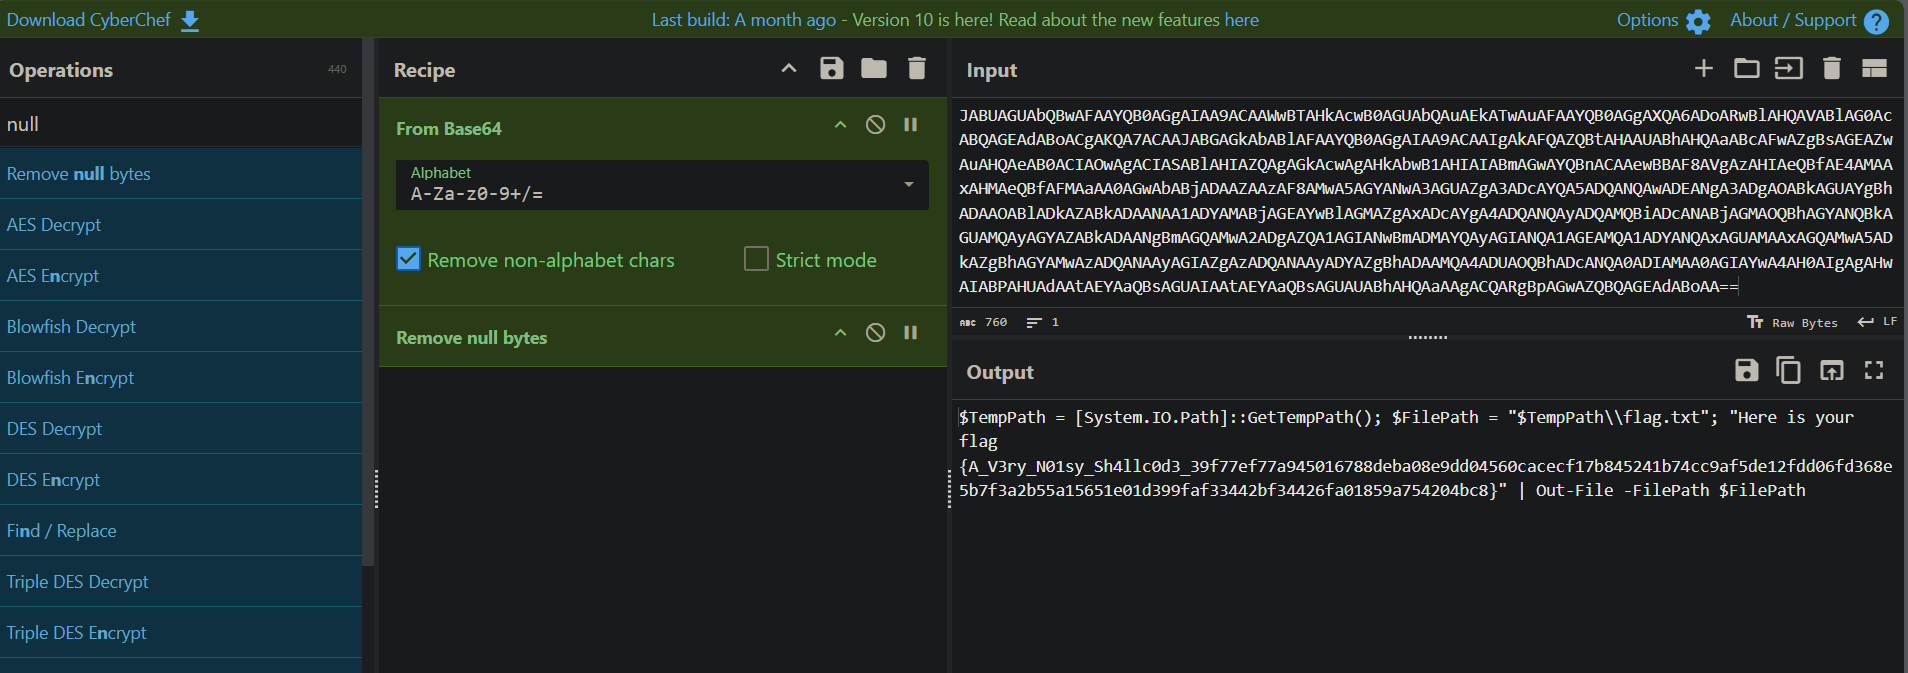
We see the command takes TempPath which is TEMP dir in windows and puts a flag.txt with the note that is our flag.
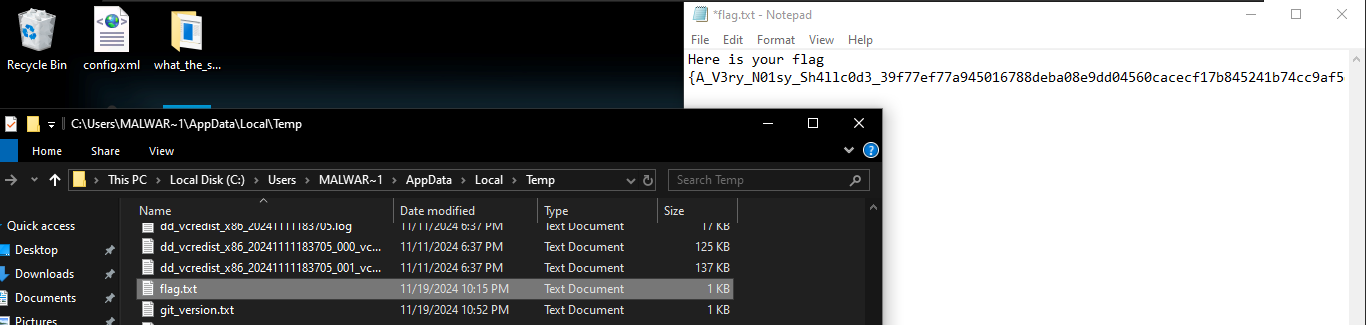
We can verify this by going to the temp directory and checking the flag.txt to see if we will get our flag.
Intended Solve
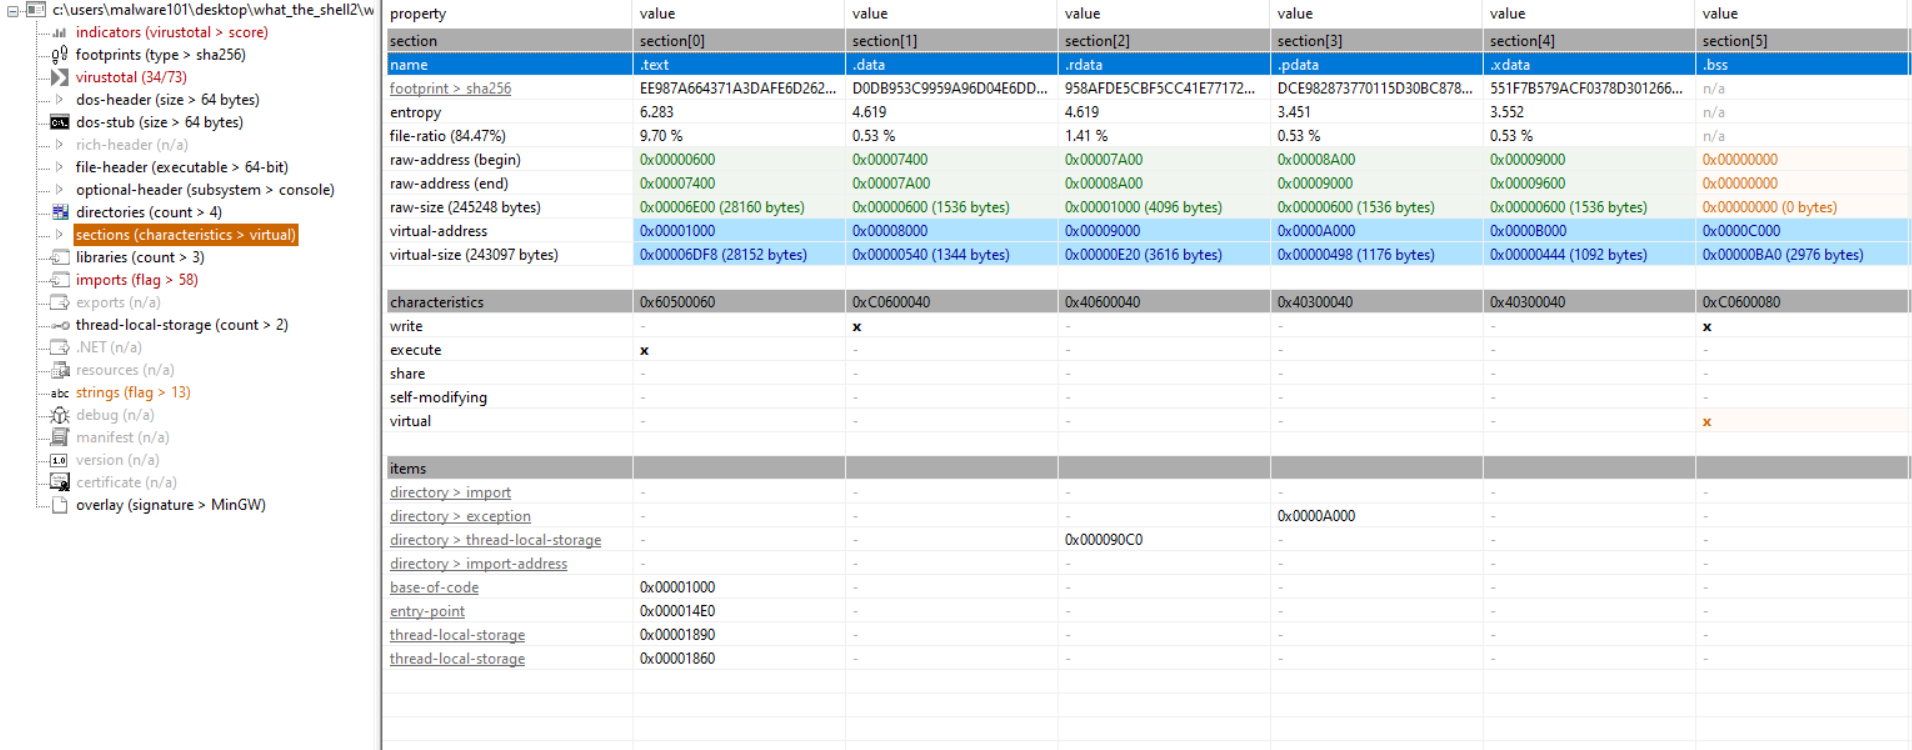
For the intended we will use x64dbg to debug our exe file and extract the shellcode. Most of the shellcodes, they are stored in 3 areas mostly .text, .rsrc and .data sections of a PE file, this can be confirmed in pestudio:
It is also good to note that, we can also see the functions used by the exe in pestudio:
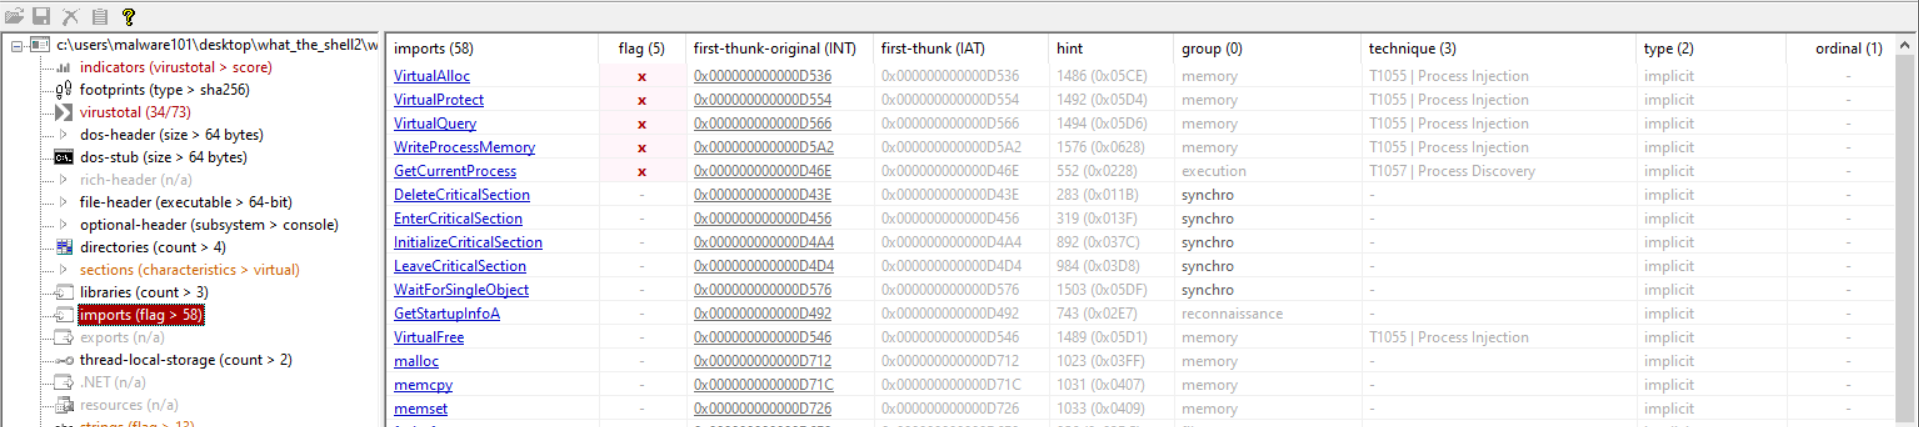
The flags with x are the most relevant and these functions show the classic pattern of shellcode injection, hence another indicator the exe has a shellcode.
We can extract the shellcode now in x64dbg. in x64dbg go to memory map and look for our executable. Since we already 3 memory regions, we should look for the one with read, write, execute which is the .data section
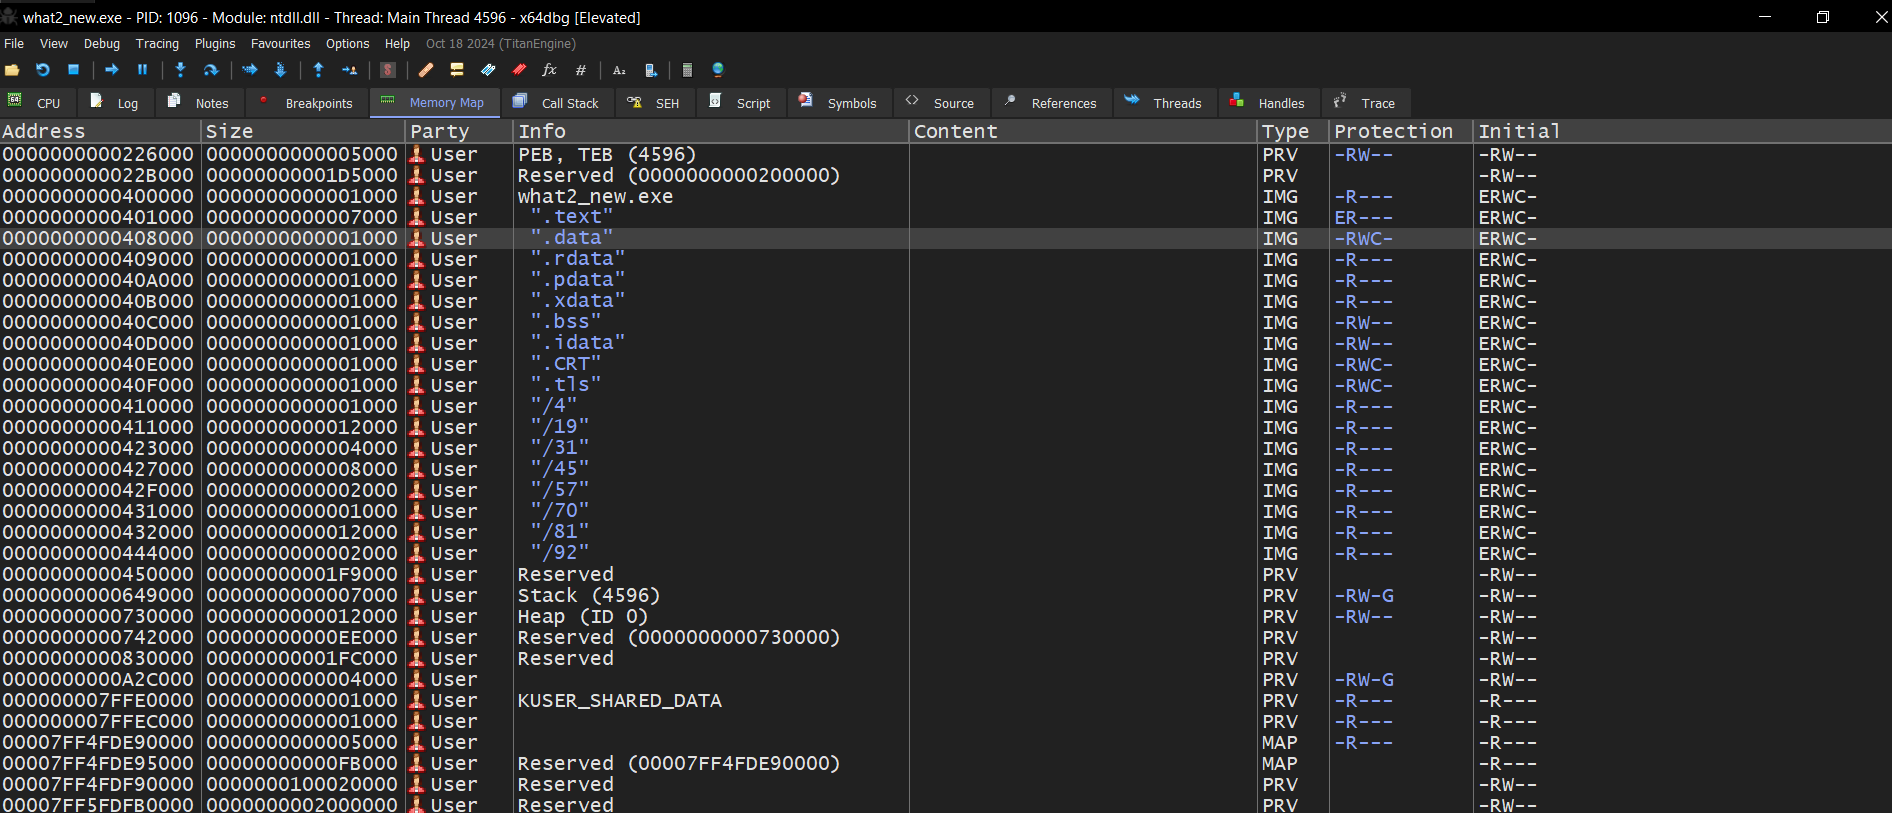
To dump it we follow it in dump as save it as a .bin file so as to use the scdbg
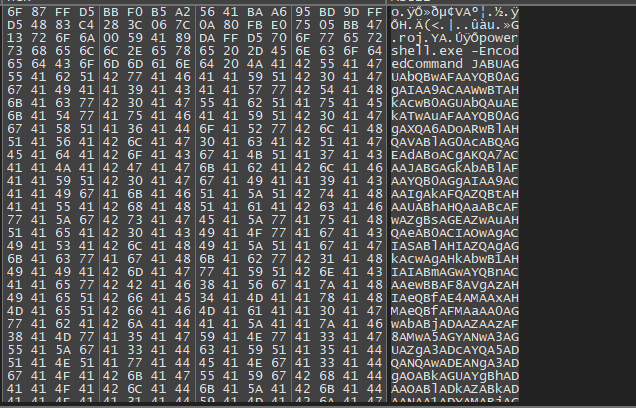
We can already see hints of powershell encoded command as the one seen on procmon, copy the whole data go to binary, save to a file, I saved mine to flag.bin.
Now we use scdbg as our whattheshell1 code or decoding the powershell and we should get our flag
| |